Lab 6: BPSK Demodulator
The purpose of this assignment is as follows.
to build a communication tool chain that combines a BPSK modulator and a BPSK Demodulator using two MSP432 boards
to evaluate the transmission quality of the link by drawing the eye diagram of the communication
to optimize the eye diagram by experimenting with techniques that reduce intersymbol interference
BPSK Demodulator
This lab is a shorter lab, that continues experiment with the BPSK modulator. In class, we discussed the Costas loop as a solution to synchronously demodulate BPSK-modulated signals. This lab will start from that reference repository and ask you to make small modifications while observing and analyzing the impact.
To complete this lab, you will need two MSP432 + AUDIO BOOSTXL kits. One of them will play the role of transmitter, while the other will play the role of receiver. We will use the loudspeaker of one board as a transmitter for audio-range BPSK signals, and we will use the microphone of the other board as a receiver for audio-range BPSK signals.
Your first task is therefore to build this setup starting from the provided coded. Configure one board with the transmitter code, and a second board with the receiver code. Put the boards close to one another. Attach a dual-trace oscilloscope to the output of the DAC of the transmitter board (showing the BPSK-modulated signal) and to the output of the DAC of the receiver board (showing the demodulated baseband signal). You should be able to capture a plot similar to the one shown below.
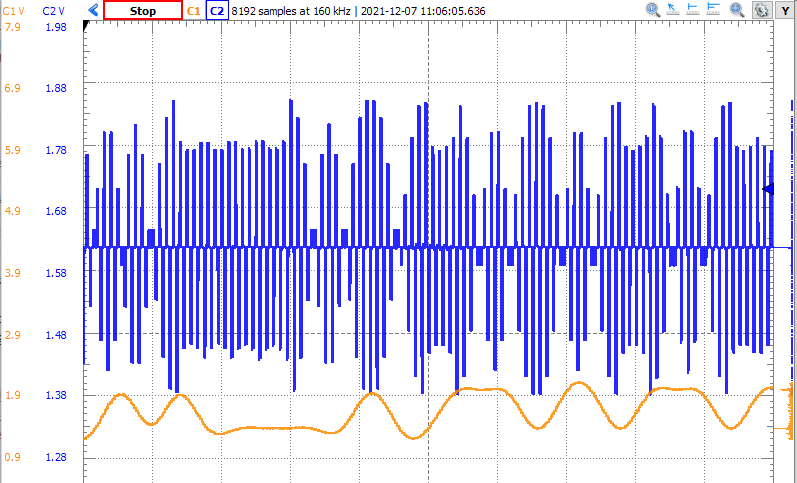
In particular, make sure that you can relate the modulation to the demodulated signal.
Important
Question 1: Make a block diagram of the complete transmission chain, showing all components of the modulator and demodulator. Male a note of the key modulation parameters: sample frequency, carrier frequency, symbol frequency, length of the root-raised cosine filter, roll-off factor of the root-raised cosine filter.
In addition, include a scope plot of the system in operation, similar to the scope plot shown above.
Measuring Inter Symbol Interference
A very important quality parameter in a BPSK modulation scheme is the so-called Inter Symbol Interference or ISI. This measures how sharp each symbol is present in the demodulated baseband waveform. When the interpolation is not perfect, then each symbol will start to affect the surrounding symbols by making the baseband signal a bit higher or lower, depending on the direction of the surround symbols. This jitter degrades the quality of the reception, because it reduces the margin between a ‘-1’ symbol and a ‘+1’ symbol, thereby increasing the bit error rate.
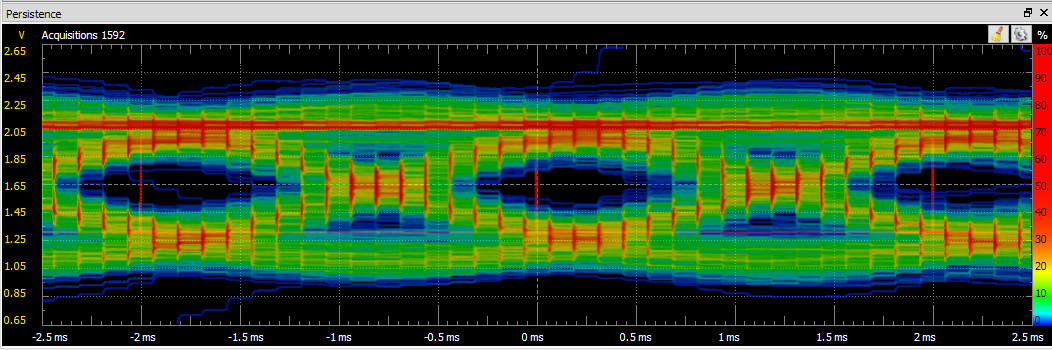
ISI is often measured by drawing the eye diagram of the received baseband signal. The eye diagram is a simple plot of the baseband signal over a period of a symbol, and using persistence while plotting. This enables us to see the different intepolation trajectories that each symbol may experience, leading to an eye that indicates the optimal decision points of the reception. The following is an example of an eye diagram captured from the reference implementation using Analog Discovery 2.
Note that drawing of an eye diagram requires you to synchronize the trace plotting with the symbol rate. Therefore, you may have to extend the receiver code to create such a sychronization signal - basically a pulse that is high for one sample for every 16 samples. This works because the symbol rate is fixed to 16 samples per symbol.
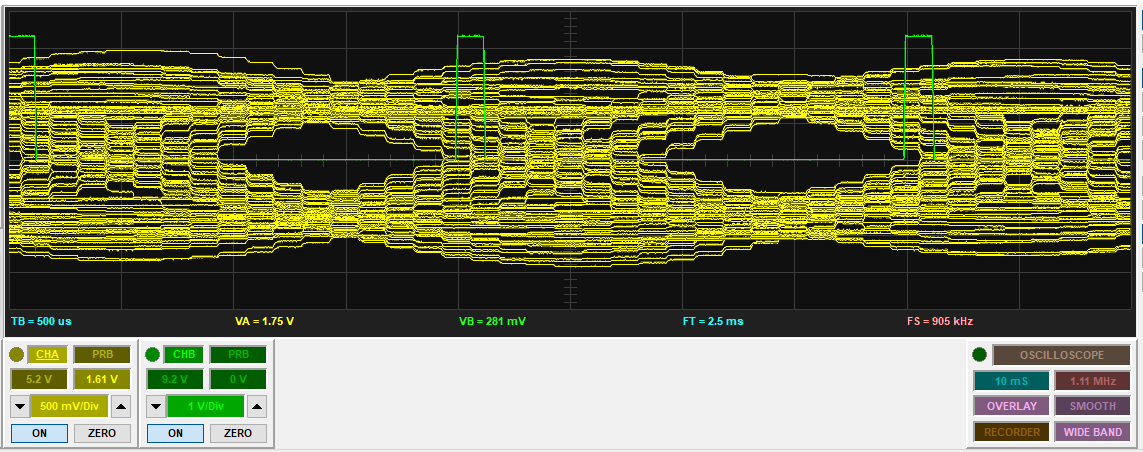
It is also possible to make this plot using Bitscope, when you turn on the overlay plotting mode. The following shows an example, this time on a diagram showing two eyes.
Important
Question 2: Add a symbol synchronization signal to the receiver (for example, by making use of xlaudio_debugPinHigh() and xlaudio_debugPinLow()) such
that you can precisely detect the start of a symbol.
Next, make an eye diagram for the communication system that you are analyzing. Note that this requires both the receiver and tranmitter to run at the same time.
Optimizing Inter Symbol Interference
Finally, we can optimize the design and reduce the inter symbol interference. There are several ways to achieve this. For example, by increasing the length of the root raised cosine filter, or by increasing the number of samples per symbol (essentially by slowing down the symbol rate).
Find a way to reduce symbol interference and demonstrate it on your setup by measuring the eye diagram of the optimized implementation. You must be able to show that the eye of the scheme with least ISI will be the most ‘open’ eye, with the largest decision margines between a +1 symbol and a -1 symbol.
Important
Question 3: Reduce the inter symbol interference by changing the RRC filter (making it longer), or else by increasing the number of samples per symbol. The latter optimization changes the symbol rate, which is OK for this question as long as your eye diagram has a better quality (a ‘more open’ eye).
Wrapping Up
The answer to this lab consists of a written report which will be submitted on Canvas by the deadline. Refer to the General Lab Report Guidelines for details on report formatting. You will only submit your written report on Canvas. All code developed must be returned through GitHub.
Follow the principal structure of the report you’ve used for Lab 5 (taking into account any feedback you have received).
Follow the four questions outlined above to structure your report. Use figures, screenshots and code examples where appropriate. Please work out the answers in sufficient detail to show your analysis.
Make sure that you add newly developed projects to github: Use the Team - Share pop-up menu and select your repository for this lab. Further, make sure that you commit and push all changes to the github repository on GitHub classroom. Use the Team - Commit pop-up menu and push all changes.
Be aware that each of the laboratory assignments in ECE4703 will require a significant investment in time and preparation if you expect to have a working system by the assignment’s due date. This course is run in “open lab” mode where it is not expected that you will be able to complete the laboratory in the scheduled official lab time. It is in your best interest to plan ahead so that you can use the TA and instructor’s office hours most efficiently.
Good Luck
Grading Rubric
Requirement |
Points |
|---|---|
Question 1 Analysis |
25 |
Question 2 Analysis |
25 |
Question 3 Analysis |
25 |
All projects build without errors or warnings |
5 |
Code is well structured and commented |
5 |
Git Repository is complete and up to date |
5 |
Overall Report Quality (Format, Outline, Grammar) |
10 |
TOTAL |
100 |